FairlawnGig Delivers Record Customer Satisfaction in a Pandemic Year
In April of 2021, FairlawnGig surveyed its residential customers in an effort to better measure the impact the network has on the community and measure customer satisfaction. The survey consisted of ten questions and took on average two minutes to complete. In two weeks, 436 residential customers responded, yielding an accuracy of +/- 5% and results consistent with our 2020 customer survey.
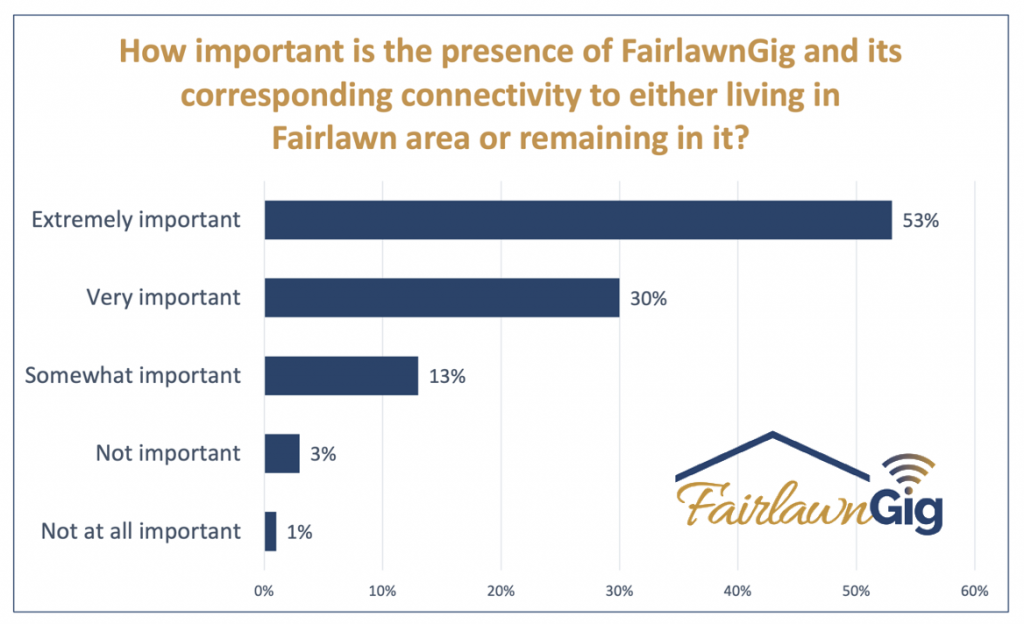
Overall satisfaction amongst household customers is 96% with more than 4 in 5 (82%) saying they are “very satisfied” with FairlawnGig. This is up slightly (2%) from 2020.
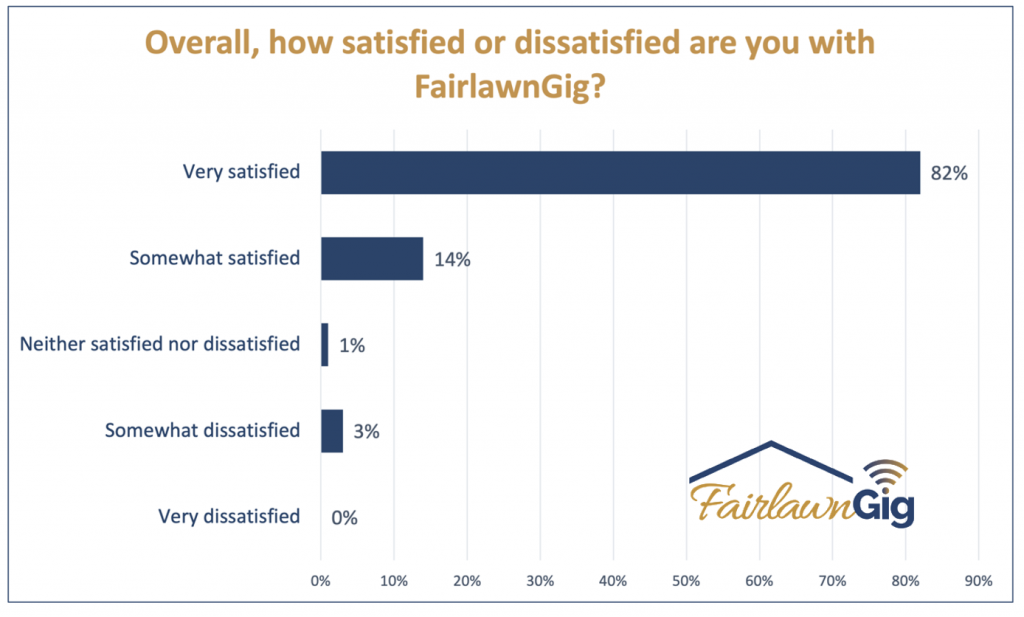 When asked to rate the FairlawnGig’s customer service, 4 in 5 (80%) said “excellent” while no respondents rated FairlawnGig’s service “fair” or “poor.”
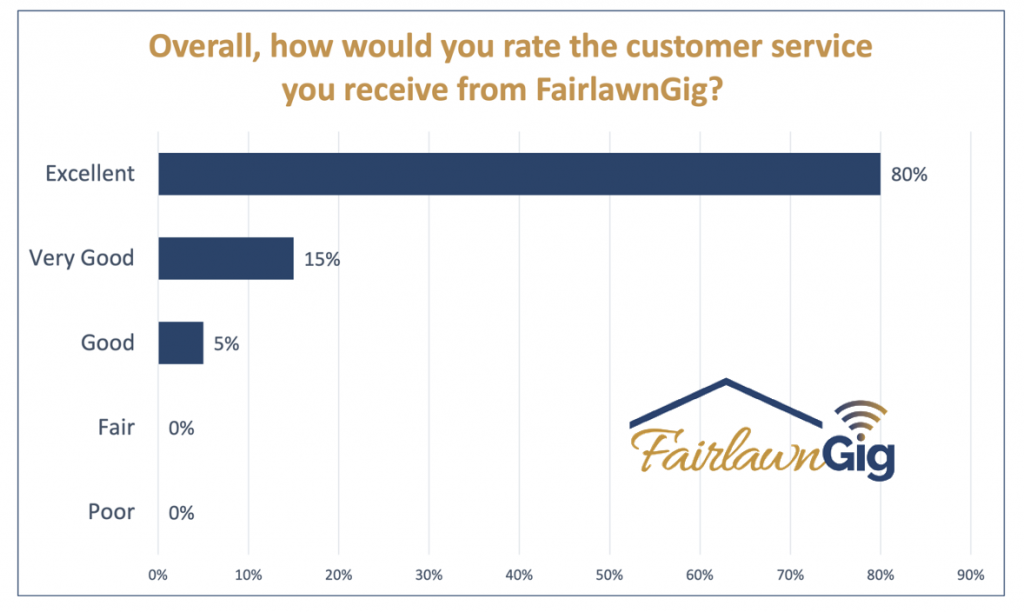 Almost all of Fairlawn residents say FairlawnGig is at least “somewhat important” to living in Fairlawn while more than 4 in 5 (83%) say it is either “extremely” or “very important. Post-pandemic, this is a 6% increase from 2020 survey results.
Concurrently, home sales rose 18% in Fairlawn in 2020.
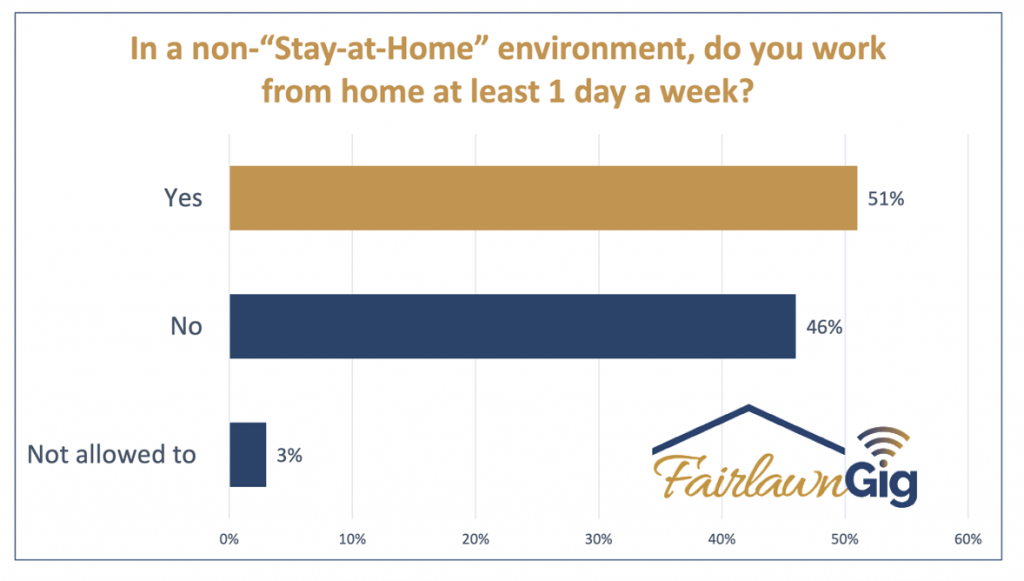
 According to Pew Research, the 2020 pandemic increased “work from home” from 20% of American workers to 54%. Fairlawn residents will remain in line with these national figures yet only increased slightly from 2020 survey results, revealing that work-from-home is not a new phenomenon for FairlawnGig customers.
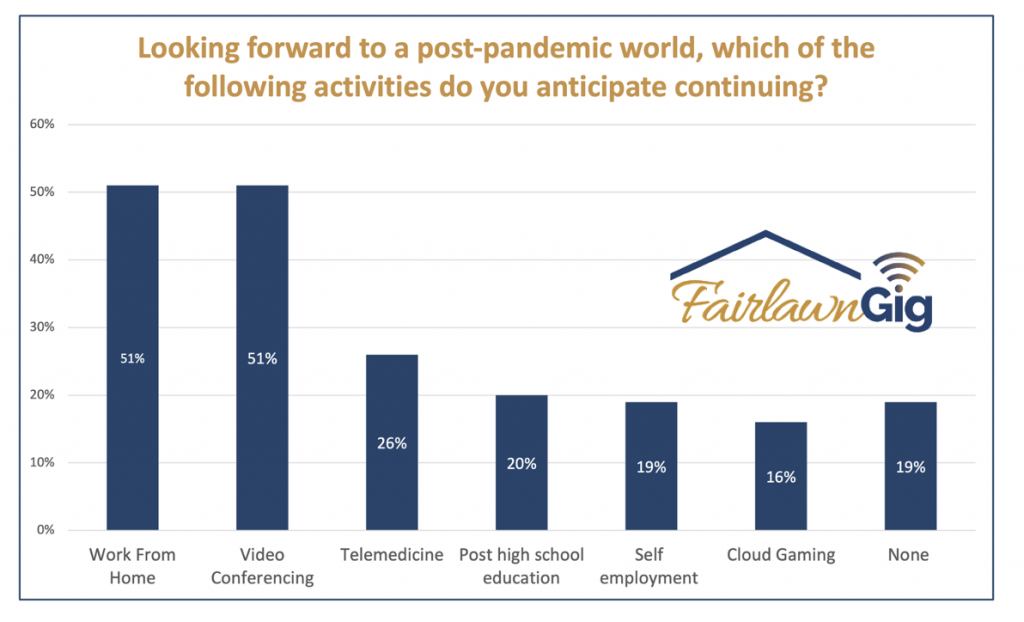
 In continuing our measurement of post-pandemic, FairlawnGig-enabled economic activities, videoconferencing (51%), telemedicine (26%) and continuing education (20%) were all expected to continue by residents.
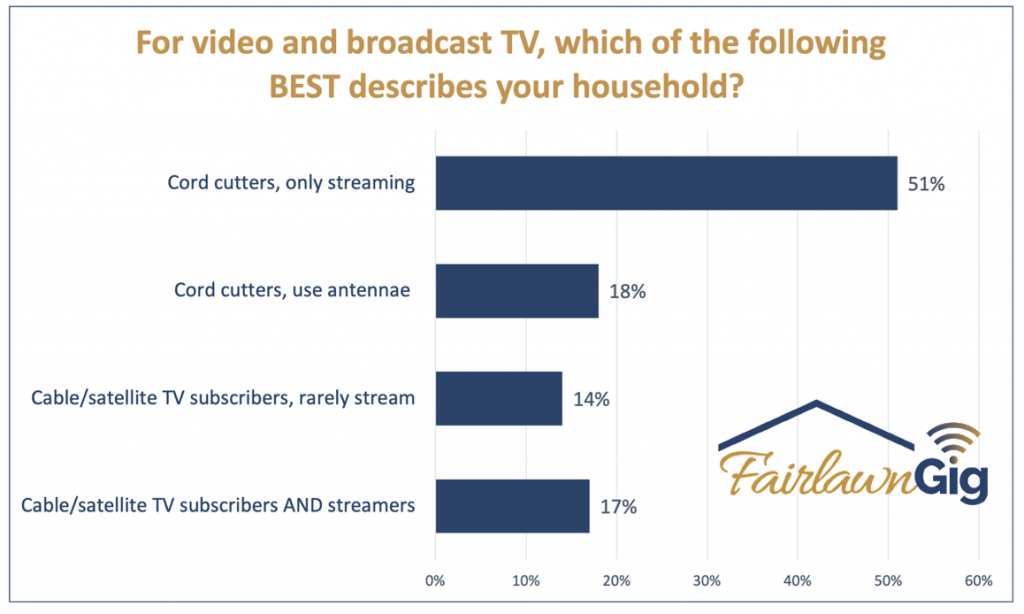
 While traditional ISPs offer television service, FairlawnGig does not. In spite of this, the service has reached a more than 60% take rate in our service footprint. In 2021, we decided to examine how many customers are cord cutters versus continuing to subscribe to cable or satellite TV services. While FairlawnGig’s total cord-cutting numbers 69%, it is also notable that nearly a third (31%) of FairlawnGig customers are choosing to pay for both traditional television and FairlawnGig. This reveals that for these customers, the cost-saving practice of “bundling” services is not a driver.
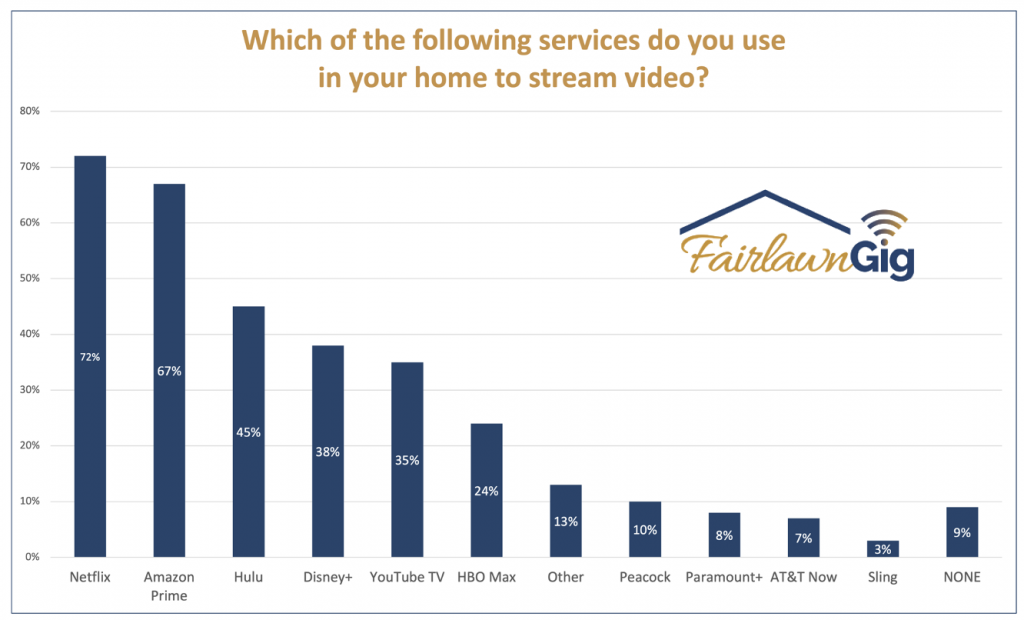
 How are customers streaming? Netflix (72%), Amazon (67%), Hulu (45%), and newcomer Disney+ are the most popular streaming platforms.
 Finally, and perhaps most importantly, is the “Net Promoter Score” (NPS). A Net Promoter Score gauges customer loyalty and should correlate with revenue growth. The NPS is figured with one simple question:
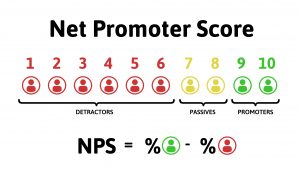 When examining the actual numbers given by respondents, 88% answered a 9 or a 10 while the average numerical answer was 9.5.
NPS classifies FairlawnGig’s customers in its standard categories that follow:
When asked to rate the FairlawnGig’s customer service, 4 in 5 (80%) said “excellent” while no respondents rated FairlawnGig’s service “fair” or “poor.”
Almost all of Fairlawn residents say FairlawnGig is at least “somewhat important” to living in Fairlawn while more than 4 in 5 (83%) say it is either “extremely” or “very important. Post-pandemic, this is a 6% increase from 2020 survey results.
Concurrently, home sales rose 18% in Fairlawn in 2020.
According to Pew Research, the 2020 pandemic increased “work from home” from 20% of American workers to 54%. Fairlawn residents will remain in line with these national figures yet only increased slightly from 2020 survey results, revealing that work-from-home is not a new phenomenon for FairlawnGig customers.
In continuing our measurement of post-pandemic, FairlawnGig-enabled economic activities, videoconferencing (51%), telemedicine (26%) and continuing education (20%) were all expected to continue by residents.
While traditional ISPs offer television service, FairlawnGig does not. In spite of this, the service has reached a more than 60% take rate in our service footprint. In 2021, we decided to examine how many customers are cord cutters versus continuing to subscribe to cable or satellite TV services. While FairlawnGig’s total cord-cutting numbers 69%, it is also notable that nearly a third (31%) of FairlawnGig customers are choosing to pay for both traditional television and FairlawnGig. This reveals that for these customers, the cost-saving practice of “bundling” services is not a driver.
How are customers streaming? Netflix (72%), Amazon (67%), Hulu (45%), and newcomer Disney+ are the most popular streaming platforms.
Finally, and perhaps most importantly, is the “Net Promoter Score” (NPS). A Net Promoter Score gauges customer loyalty and should correlate with revenue growth. The NPS is figured with one simple question:
How likely is it that you would recommend FairlawnGig to a friend or family member? (on a scale of 0-10 where zero is “not at all likely” and ten is “extremely likely.”
This question produced a NPS for FairlawnGig of 84, an increase of 4 points from 2020. This puts FairlawnGig is solidly in the top quartile of organizational scores and much higher than the typical ISP, which typically have sub-20 NPS scores.*
When examining the actual numbers given by respondents, 88% answered a 9 or a 10 while the average numerical answer was 9.5.
NPS classifies FairlawnGig’s customers in its standard categories that follow:
- Promoters (88% of FairlawnGig customers). Responded 9 or 10. Likely to exhibit value-creating behaviors including buying more, remaining customers for longer, and making more positive referrals to other potential customers.
- Passives (9%). Responses of 7 or 8, unlikely to help or hurt brand.
- Detractors (3%). Responded with a score of 0 to 6. Less likely to exhibit value-creating behaviors for the brand.